Setting up a multi-tiered log infrastructure Part 1 -- Getting Started
Logging Infrastructure Overview
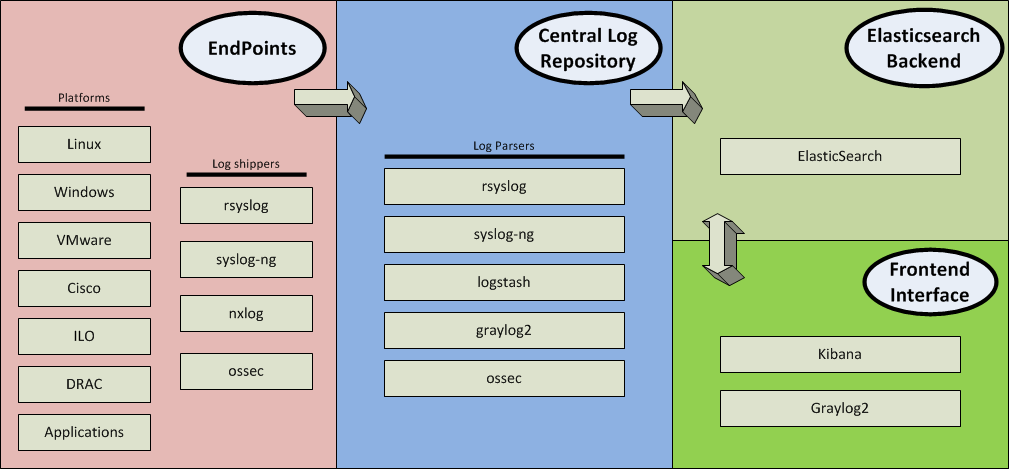
Setting up a multi-tiered logging infrastructure can be a little more complicated than just spinning up an rsyslog server and shipping logs to it (although that is an option). A few products come up repeatedly when looking for logging stack solutions—these include elasticsearch, logstash, kibana, and graylog, along with rsyslog, nxlog, syslog-ng, and OSSEC.
The ELK stack uses Elasticsearch, Logstash, and Kibana. The Graylog and Elasticsearch stack (or GELP – Graylog Enhanced Logging Platform, for lack of a better acronym) utilizes Graylog to perform the same functions as Logstash and Kibana. Graylog and rsyslog can also utilize an Elasticsearch backend for storage. nxlog, rsyslog, syslog-ng, and OSSEC are client-side log shippers, where OSSEC, rsyslog, and syslog-ng are also servers capable of receiving logs. OSSEC is not exactly a logging application, but it can analyze logs using predefined rules and alert based on them.
This list is certainly not exhaustive and does not contain commercial logging stacks such as Splunk, ArcSight, or ManageEngine EventLog Analyzer, among others.
Design Considerations
When I first started digging into this, there were no specific thoughts about an overall design. I was merely interested in getting something to work. Now that I ’ve set up a few different stacks, my thoughts turned to how might this be implemented in an enterprise network.
Endpoints might include Windows, Linux, AIX, Cisco UCS, ESXi hosts, netscalers, ILO, DRAC, IPMI etc. Then on top of that, some Apache logs, some IIS logs, email logs, WAN routers, ASA ’s, other firewalls, and a bunch of internal networking devices. There may be a need/interest for printers, power infrastructure, building automation systems, and some medical devices too.
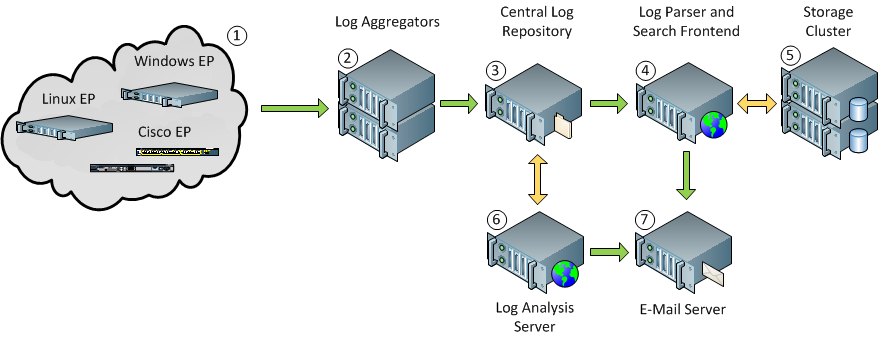
So, what is the best way to get logs from an endpoint (EP) to the Central Log Repository (CLR) then to the Elasticsearch Database Server (ESS) so a Frontend UI Server (UIS) can allow viewing them? The overall setup is EP => CLR => ESS <=> UIS. There are many alternative solutions, which all have their merits but this configuration seems easier to implement and maintain.
Just to discuss some alternative configurations, one can use rsyslog with logstash grabbing logs from a file. Other setups can pipe logs directly to logstash prior to dumping logs into elasticsearch. Sending logs directly to Graylog is yet another alternative. And another is shipping logs to rsyslog, which in turn, sends logs to elasticsearch. Add in implementing OSSEC and wanting to use TLS for shipping logs when possible, one can see how rolling out an implementation of this sort can get a little complicated.
Selected Design
The overall design allows shipping logs from endpoints to two aggregation nodes (setup as an HA cluster). Logs pass to a central log repository running rsyslog prior to being shipped to the elasticsearch backend via the log parser and search frontend. One reason for using rsyslog in between the endpoint and log parser is the backend can be changed without affecting the initial configuration, guarding against product lock in.